| Duration | 2 hours |
| Day | 7 of 7 |
Learning Objectives
By the end of this module, students will be able to:
- Implement comprehensive logging strategies
- Set up metrics and dashboards
- Configure alerting for critical issues
- Build observability into agents
Topics
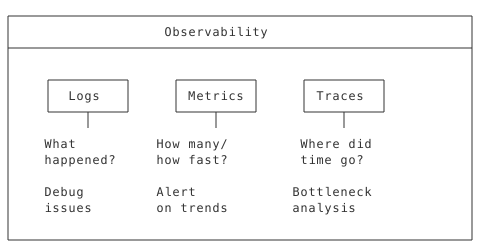
1. Observability Principles (20 min)
The Three Pillars
Voice AI Specific Metrics
| Category | Metrics |
|---|---|
| Performance | Response time, function latency |
| Quality | Recognition accuracy, task completion |
| Usage | Calls/hour, functions/call |
| Errors | Error rate, timeout rate |
| Business | Transfers, resolutions, CSAT |
2. Structured Logging (30 min)
JSON Logging Setup
import logging
import json
from datetime import datetime


class JSONFormatter(logging.Formatter):
    def format(self, record):
        log_data = {
            "timestamp": datetime.utcnow().isoformat(),
            "level": record.levelname,
            "logger": record.name,
            "message": record.getMessage(),
            "module": record.module,
            "function": record.funcName,
            "line": record.lineno
        }

        # Add extra fields
        if hasattr(record, "call_id"):
            log_data["call_id"] = record.call_id
        if hasattr(record, "customer_id"):
            log_data["customer_id"] = record.customer_id
        if hasattr(record, "duration_ms"):
            log_data["duration_ms"] = record.duration_ms

        if record.exc_info:
            log_data["exception"] = self.formatException(record.exc_info)

        return json.dumps(log_data)


def setup_logging():
    handler = logging.StreamHandler()
    handler.setFormatter(JSONFormatter())

    root_logger = logging.getLogger()
    root_logger.addHandler(handler)
    root_logger.setLevel(logging.INFO)

    return logging.getLogger("agent")
Contextual Logging
class ObservableAgent(AgentBase):
    def __init__(self):
        super().__init__(name="observable-agent")
        self.logger = setup_logging()
        self._setup_functions()

    def _setup_functions(self):
        @self.tool(
            description="Process order",
            parameters={
                "type": "object",
                "properties": {
                    "order_id": {"type": "string", "description": "Order ID"}
                },
                "required": ["order_id"]
            }
        )
        def process_order(args: dict, raw_data: dict = None) -> SwaigFunctionResult:
            order_id = args.get("order_id", "")
            raw_data = raw_data or {}
            call_id = raw_data.get("call_id", "unknown")
            global_data = raw_data.get("global_data", {})

            # Log with context
            self.logger.info(
                "Processing order",
                extra={
                    "call_id": call_id,
                    "customer_id": global_data.get("customer_id"),
                    "order_id": order_id
                }
            )

            start = time.perf_counter()
            try:
                result = process(order_id)
                duration = (time.perf_counter() - start) * 1000

                self.logger.info(
                    "Order processed successfully",
                    extra={
                        "call_id": call_id,
                        "order_id": order_id,
                        "duration_ms": duration
                    }
                )

                return SwaigFunctionResult("Order processed.")

            except Exception as e:
                self.logger.error(
                    f"Order processing failed: {e}",
                    extra={
                        "call_id": call_id,
                        "order_id": order_id
                    },
                    exc_info=True
                )
                return SwaigFunctionResult(
                    "I had trouble processing that order."
                )
Log Levels for Voice AI
| Level | Use For |
|---|---|
| DEBUG | Function inputs/outputs, state changes |
| INFO | Call events, successful operations |
| WARNING | Slow responses, retries, fallbacks |
| ERROR | Failed operations, exceptions |
| CRITICAL | System failures, security issues |
3. Metrics Collection (35 min)
Prometheus Metrics
from prometheus_client import Counter, Histogram, Gauge, start_http_server


# Define metrics
CALLS_TOTAL = Counter(
    'voice_agent_calls_total',
    'Total number of calls',
    ['agent', 'status']
)

CALL_DURATION = Histogram(
    'voice_agent_call_duration_seconds',
    'Call duration in seconds',
    ['agent'],
    buckets=[30, 60, 120, 300, 600]
)

FUNCTION_LATENCY = Histogram(
    'voice_agent_function_latency_seconds',
    'Function execution latency',
    ['agent', 'function'],
    buckets=[0.1, 0.25, 0.5, 1.0, 2.5, 5.0]
)

ACTIVE_CALLS = Gauge(
    'voice_agent_active_calls',
    'Number of active calls',
    ['agent']
)

ERRORS_TOTAL = Counter(
    'voice_agent_errors_total',
    'Total errors',
    ['agent', 'function', 'error_type']
)


class MetricsAgent(AgentBase):
    def __init__(self):
        super().__init__(name="metrics-agent")

        # Start metrics server
        start_http_server(9090)

        self._setup_functions()

    def _setup_functions(self):
        @self.tool(
            description="Get account balance",
            parameters={
                "type": "object",
                "properties": {
                    "account_id": {"type": "string", "description": "Account ID"}
                },
                "required": ["account_id"]
            }
        )
        def get_balance(args: dict, raw_data: dict = None) -> SwaigFunctionResult:
            account_id = args.get("account_id", "")
            with FUNCTION_LATENCY.labels(
                agent="metrics-agent",
                function="get_balance"
            ).time():
                try:
                    balance = fetch_balance(account_id)
                    return SwaigFunctionResult(f"Balance: ${balance}")

                except Exception as e:
                    ERRORS_TOTAL.labels(
                        agent="metrics-agent",
                        function="get_balance",
                        error_type=type(e).__name__
                    ).inc()
                    raise
Custom Business Metrics
TRANSFERS_TOTAL = Counter(
    'voice_agent_transfers_total',
    'Call transfers',
    ['agent', 'department']
)

RESOLUTIONS_TOTAL = Counter(
    'voice_agent_resolutions_total',
    'Issues resolved',
    ['agent', 'resolution_type']
)

CSAT_SCORES = Histogram(
    'voice_agent_csat_score',
    'Customer satisfaction scores',
    ['agent'],
    buckets=[1, 2, 3, 4, 5]
)


class BusinessMetricsAgent(AgentBase):
    @AgentBase.tool(
        description="Transfer call",
        parameters={
            "type": "object",
            "properties": {
                "department": {"type": "string", "description": "Department name"}
            },
            "required": ["department"]
        }
    )
    def transfer(self, args: dict, raw_data: dict = None) -> SwaigFunctionResult:
        department = args.get("department", "")
        TRANSFERS_TOTAL.labels(
            agent="business-agent",
            department=department
        ).inc()

        return (
            SwaigFunctionResult(f"Transferring to {department}.")
            .connect(get_dept_number(department), final=True)
        )

    @AgentBase.tool(
        description="Record resolution",
        parameters={
            "type": "object",
            "properties": {
                "resolution_type": {"type": "string", "description": "Type of resolution"}
            },
            "required": ["resolution_type"]
        }
    )
    def resolve_issue(self, args: dict, raw_data: dict = None) -> SwaigFunctionResult:
        resolution_type = args.get("resolution_type", "")
        RESOLUTIONS_TOTAL.labels(
            agent="business-agent",
            resolution_type=resolution_type
        ).inc()

        return SwaigFunctionResult("Issue marked as resolved.")
4. Distributed Tracing (25 min)
OpenTelemetry Setup
from opentelemetry import trace
from opentelemetry.sdk.trace import TracerProvider
from opentelemetry.sdk.trace.export import BatchSpanProcessor
from opentelemetry.exporter.otlp.proto.grpc.trace_exporter import OTLPSpanExporter


def setup_tracing():
    provider = TracerProvider()
    processor = BatchSpanProcessor(OTLPSpanExporter())
    provider.add_span_processor(processor)
    trace.set_tracer_provider(provider)
    return trace.get_tracer("voice-agent")


tracer = setup_tracing()


class TracedAgent(AgentBase):
    def __init__(self):
        super().__init__(name="traced-agent")
        self._setup_functions()

    def _setup_functions(self):
        @self.tool(
            description="Complex operation",
            parameters={
                "type": "object",
                "properties": {
                    "data": {"type": "string", "description": "Data to process"}
                },
                "required": ["data"]
            }
        )
        def complex_operation(args: dict, raw_data: dict = None) -> SwaigFunctionResult:
            data = args.get("data", "")
            raw_data = raw_data or {}
            call_id = raw_data.get("call_id", "unknown")

            with tracer.start_as_current_span("complex_operation") as span:
                span.set_attribute("call_id", call_id)
                span.set_attribute("input_length", len(data))

                # Step 1: Validate
                with tracer.start_as_current_span("validate"):
                    validated = validate(data)

                # Step 2: Process
                with tracer.start_as_current_span("process"):
                    result = process(validated)

                # Step 3: Store
                with tracer.start_as_current_span("store"):
                    store(result)

                span.set_attribute("success", True)
                return SwaigFunctionResult("Operation completed.")
Trace Correlation
class CorrelatedAgent(AgentBase):
    def __init__(self):
        super().__init__(name="correlated-agent")
        self._setup_functions()

    def _setup_functions(self):
        @self.tool(
            description="API call with tracing",
            parameters={
                "type": "object",
                "properties": {
                    "endpoint": {"type": "string", "description": "API endpoint"}
                },
                "required": ["endpoint"]
            }
        )
        def call_api(args: dict, raw_data: dict = None) -> SwaigFunctionResult:
            endpoint = args.get("endpoint", "")
            raw_data = raw_data or {}
            call_id = raw_data.get("call_id", "unknown")

            with tracer.start_as_current_span("api_call") as span:
                # Add trace context to outgoing request
                headers = {
                    "X-Call-ID": call_id,
                    "X-Trace-ID": span.get_span_context().trace_id
                }

                response = requests.get(
                    endpoint,
                    headers=headers,
                    timeout=5
                )

                span.set_attribute("http.status_code", response.status_code)

                return SwaigFunctionResult(f"API returned: {response.json()}")
5. Alerting and Dashboards (30 min)
Alert Rules (Prometheus)
# alerts.yml
groups:
  - name: voice_agent_alerts
    rules:
      # High error rate
      - alert: HighErrorRate
        expr: |
          sum(rate(voice_agent_errors_total[5m]))
          / sum(rate(voice_agent_calls_total[5m])) > 0.05
        for: 5m
        labels:
          severity: critical
        annotations:
          summary: "High error rate (>5%)"
          description: "Error rate is %"

      # Slow function latency
      - alert: SlowFunctionLatency
        expr: |
          histogram_quantile(0.95,
            rate(voice_agent_function_latency_seconds_bucket[5m])
          ) > 2
        for: 5m
        labels:
          severity: warning
        annotations:
          summary: "P95 latency > 2s"

      # High transfer rate
      - alert: HighTransferRate
        expr: |
          sum(rate(voice_agent_transfers_total[1h]))
          / sum(rate(voice_agent_calls_total[1h])) > 0.3
        for: 15m
        labels:
          severity: warning
        annotations:
          summary: "Transfer rate >30%"
          description: "May indicate AI handling issues"

      # No calls (system down?)
      - alert: NoIncomingCalls
        expr: |
          sum(rate(voice_agent_calls_total[10m])) == 0
        for: 15m
        labels:
          severity: critical
        annotations:
          summary: "No incoming calls for 15 minutes"
Grafana Dashboard (JSON)
{
  "dashboard": {
    "title": "Voice Agent Overview",
    "panels": [
      {
        "title": "Calls per Minute",
        "type": "graph",
        "targets": [{
          "expr": "sum(rate(voice_agent_calls_total[1m])) * 60"
        }]
      },
      {
        "title": "Error Rate",
        "type": "gauge",
        "targets": [{
          "expr": "sum(rate(voice_agent_errors_total[5m])) / sum(rate(voice_agent_calls_total[5m])) * 100"
        }],
        "options": {
          "thresholds": [
            {"value": 0, "color": "green"},
            {"value": 2, "color": "yellow"},
            {"value": 5, "color": "red"}
          ]
        }
      },
      {
        "title": "Function Latency (P95)",
        "type": "graph",
        "targets": [{
          "expr": "histogram_quantile(0.95, rate(voice_agent_function_latency_seconds_bucket[5m]))",
          "legendFormat": ""
        }]
      },
      {
        "title": "Active Calls",
        "type": "stat",
        "targets": [{
          "expr": "sum(voice_agent_active_calls)"
        }]
      }
    ]
  }
}
Health Check Endpoint
from fastapi import FastAPI
from datetime import datetime

app = FastAPI()


@app.get("/health")
async def health():
    """Comprehensive health check."""
    checks = {}

    # Check agent
    try:
        agent.get_swml()
        checks["agent"] = {"status": "healthy"}
    except Exception as e:
        checks["agent"] = {"status": "unhealthy", "error": str(e)}

    # Check database
    try:
        db.ping()
        checks["database"] = {"status": "healthy"}
    except Exception as e:
        checks["database"] = {"status": "unhealthy", "error": str(e)}

    # Check external API
    try:
        response = requests.get("https://api.example.com/health", timeout=2)
        checks["external_api"] = {
            "status": "healthy" if response.ok else "degraded"
        }
    except Exception as e:
        checks["external_api"] = {"status": "unhealthy", "error": str(e)}

    # Overall status
    all_healthy = all(c["status"] == "healthy" for c in checks.values())

    return {
        "status": "healthy" if all_healthy else "degraded",
        "timestamp": datetime.utcnow().isoformat(),
        "checks": checks
    }
Observability Checklist
Logging
- Structured JSON logging
- Correlation IDs (call_id)
- Appropriate log levels
- Sensitive data excluded
Metrics
- Call counters
- Function latency histograms
- Error counters
- Business metrics
Alerting
- Error rate alerts
- Latency alerts
- Availability alerts
- Business metric alerts
Dashboards
- Real-time call volume
- Error rate trends
- Latency percentiles
- Business KPIs
Key Takeaways
- Structure your logs - JSON enables querying
- Measure what matters - Business metrics, not just technical
- Alert on symptoms - User impact, not infrastructure
- Correlate across systems - Trace ID propagation
- Dashboard for insight - Not just data, but understanding
Preparation for Lab 3.5
- Set up Prometheus and Grafana (or cloud equivalent)
- Identify key metrics for your agent
- Define alerting thresholds
Lab Preview
In Lab 3.5, you will:
- Implement structured logging
- Add Prometheus metrics
- Create a Grafana dashboard
- Configure critical alerts